

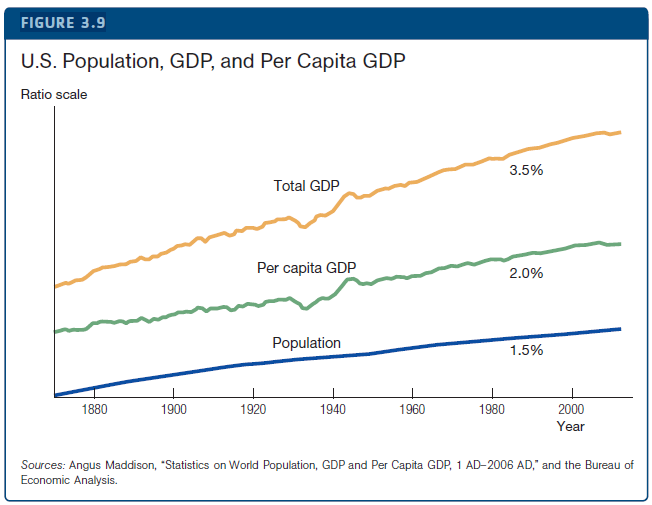
Why, and in what sense, do the three growth rates shown in Figure 3.9 add up? FIGURE
Question:
Fantastic news! We've Found the answer you've been seeking!
Step by Step Answer:
The growth rate of ...View the full answer

Answered By
Shivani Dubey
Hello guys, I am very good with the Advance mathematics, Calculus, Number theory, Algebra, Linear algebra, statistics and almost all topics of mathematics. I used to give individual tutoring students in offline mode but now want to help students worldwide so I am joining here. I can also give solutions in various coding languages of mathematics and software like mathematica, R, Latex, Matlab, Statistica, etc.
feel free to ask any doubt regarding mathematics
2+ Reviews
10+ Question Solved
Related Book For 

Question Posted:
