

Sippican Corporation (A)* The decline in our profits has become intolerable. The severe price cutting in pumps
Question:
Sippican Corporation (A)*
The decline in our profits has become intolerable. The severe price cutting in pumps has dropped our pre-tax margin to less than 2%, far below our historical 15% margins. Fortunately, our competitors are overlooking the opportunities for profit in flow controllers. Our recent 10% price increase in that line has been implemented without losing any business.
Robert Parker, President of Sippican Corporation
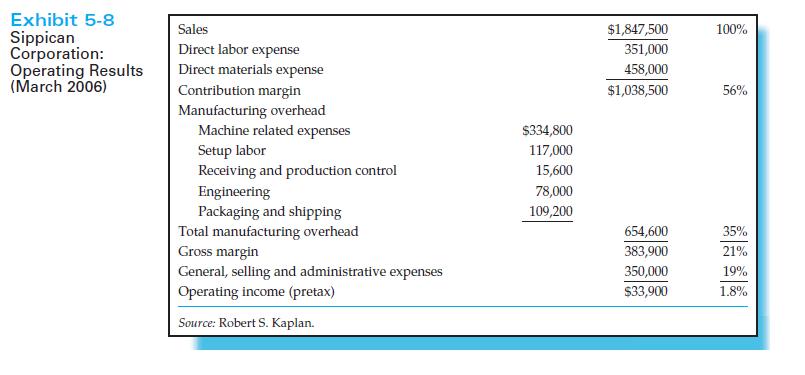
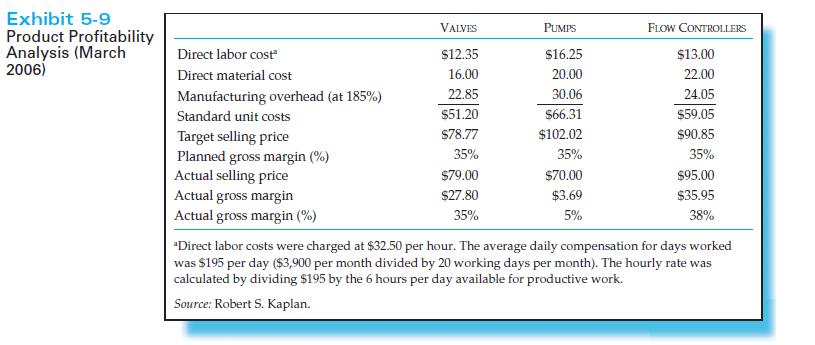
Robert Parker was discussing operating results in the latest month with Peggy Knight, his controller, and John Scott, his manufacturing manager. The meeting among the three was taking place in an atmosphere tinged with apprehension because competitors had been reducing prices on pumps, Sippican’s major product line. Since pumps were a commodity product, Parker had seen no alternative but to match the reduced prices to maintain volume. But the price cuts had led to declining company profits, especially in the pump line (summary operating results for the previous month, March 2006, are shown in Exhibits 5-8 and 5-9).
Sippican supplied products to manufacturers of water purification equipment. The company had started with a unique design for valves that it could produce to tolerances that were better than any in the industry. Parker quickly established a loyal customer base because of the high quality of its manufactured valves. He and Scott realized that Sippican’s existing labor skills and machining equipment could also be used to produce pumps and flow controllers, products that were also purchased by its customers. They soon established a major presence in the high-volume pump product line and the more customized flow controller line.
Sippican’s production process started with the purchase of semi finished components from several suppliers. It machined these parts to the required tolerances and assembled them in the company’s modern manufacturing facility. The same equipment and labor were used for all three product lines, and production runs were scheduled to match customer shipping requirements. Suppliers and customers had agreed to just-in-time deliveries, and products were packed and shipped as completed.
Valves were produced by assembling four different machined components. Scott had designed machines that held components in fixtures so that they could be machined automatically. The valves were standard products and could be produced and shipped in large lots. Although Scott felt several competitors could now match Parker’s quality in valves, none had tried to gain market share by cutting price, and gross margins had been maintained at a standard 35%.
The manufacturing process for pumps was practically identical to that for valves. Five components were machined and then assembled into the final product. The pumps were shipped to industrial product distributors after assembly. Recently, it seemed as if each month brought new reports of reduced prices for pumps. Sippican had matched the lower prices so that it would not give up its place as a major pump supplier. Gross margins on pump sales in the latest month had fallen to about 5%, well below the company’s planned gross margin of 35%.
Flow controllers were devices that controlled the rate and direction of flow of chemicals. They required more components and more labor, than pumps or valves, for each finished unit. Also, there was much more variety in the types of flow controllers used in industry, so many more production runs and shipments were performed for this product line than for valves. Sippican had recently raised flow controller prices by more than 10% with no apparent effect on demand.
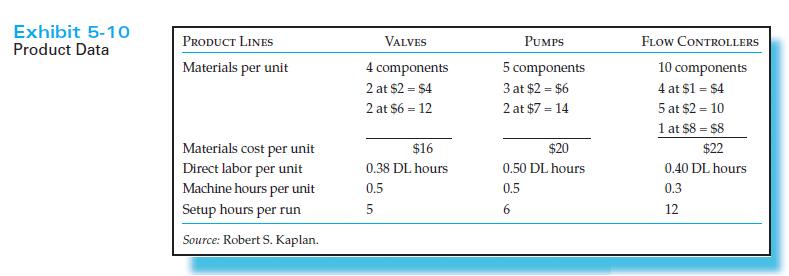
Sippican had always used a simple cost accounting system. Each unit of product was charged for direct material and labor cost. Material cost was based on the prices paid for components under annual purchasing agreements. Labor rates, including fringe benefits, were $32.50 per hour**, and were charged to products based on the standard run times for each product (see Exhibit 5-10). The company had only one producing department, in which components were both machined and assembled into finished products. The overhead costs in this department were allocated to products as a percentage of production-run direct labor cost. Currently, the rate was 185%. Since direct labor cost had to be recorded anyway to prepare factory payroll, this was an inexpensive way to allocate overhead costs to products.
Knight noted that some companies did not allocate any overhead costs to products, treating them as period, not product, expenses. For these companies, product profitability was measured at the contribution margin level—price less all variable costs. Sippican’s variable costs were only its direct material and direct labor costs. On that basis, all products, including pumps, would be generating substantial contribution to overhead and profits. She thought that perhaps some of Sippican’s competitors were following this procedure and pricing to cover variable costs.
Knight had recently led a small task force to study Sippican’s overhead costs since they had now become much larger than the direct labor expenses. The study had revealed the following information:
1. A setup had to be performed each time a batch of components had to be machined in a production run. Each component in a product required a separate production machine to run the raw material or purchased part to the specifications for the product. Workers often operated several of the machines simultaneously once they had set up the machine. Because of the large number of setups, Sippican had dedicated about 25% of its production workforce to focus exclusively on setups. Some production workers did not operate any machines; they performed only manual assembly work. Their assembly time per product was included in the direct labor hour estimates for each product.
Sippican operated two 71⁄2-hour shifts each weekday. Each shift employed 45 production and assembly workers, plus 15 setup workers. Workers received two 15-minute breaks each day. They received an average of 30 minutes per day for training and education activities, and all workers—production, assembly, and setup—spent 30 minutes each shift on doing preventive maintenance and minor repairs to the machines.
2. The company had 62 machines for component processing. These machines were generally available for the six hours per shift that production workers were actively engaged in production or setup activities on the machines. Sippican leased the machines. Each machine’s operating expenses were about $5,400 per month, including lease payments, supplies, utilities, and maintenance and repairs.
3. The receiving and production control departments employed four people over the two shifts. These personnel ordered, processed, inspected, and moved each batch of components for a production run. It took a total of 75 minutes for all of the activities required to get one batch of components ordered, received, and moved to a machine for processing. This time was independent of whether the components were for a long or a short production run, or whether the components were expensive or inexpensive.
4. The work in the packaging and shipping area had increased during the past couple of years as Sippican increased the number of customers it served. Each shipment took 50 minutes to prepare the packages and labels, independent of the number or types of items in the shipment, plus 8 minutes per item to bubble wrap and pack in the carton, whether the item was a valve, pump, or flow controller. The packaging and shipping area employed 14 people in each of the two shifts (28 in total).
Employees in the receiving, production control, packaging, and shipping departments worked a 71⁄2-hour shift that included two 15-minute breaks per day, and 30 minutes, on average, for training and education.
5. Sippican employed eight engineers for designing and developing new product varieties. Engineers’ total compensation was $9,750 per month. Much of their time was spent modifying flow control products to conform to customer requests. Engineers worked 71⁄2-hour shifts. After breaks, training, education, and professional activities, engineers supplied about 6 hours of productive work per shift.
Knight’s team had collected the data shown in Exhibit 5-11 based on operations in March 2006. The team felt that this month was typical of ongoing operations.
Required
(a) Calculate the practical capacity and the capacity cost rates for each of Towerton’s personnel resources: brokers, account managers, financial planners, principals, and customer service representatives.
(b) Calculate the practical capacity and the capacity cost rates for each of Sippican’s resources: production and setup employees, machines, receiving and production control employees, shipping and packaging employees, and engineers.
(c) Using these capacity cost rates and the production data in Exhibits 5-10 and 5-11, calculate revised costs and profits for Sippican’s three product lines. What difference does your cost assignment have on reported product costs and profitability? What causes any shifts in cost and profitability?
(d) Could this approach be extended to service companies and to companies much larger and more complex than Sippican? What would be the barriers and difficulties with implementing time-driven ABC in practice?
(e) On the basis of the revised cost and profitability estimates, what actions should Sippican’s management team take to improve the company’s profitability?
*Copyright © 2006 President and Fellows of Harvard College. Harvard Business School Case 9 106-058. This case was prepared by Professor Robert S. Kaplan as the basis for class discussion rather than to illustrate either effective or ineffective handling of an administrative situation. Reprinted by permission of Harvard Business School.
**The full compensation, including fringe benefits, for direct and indirect employees (other than engineers) was $3,900 per month. Employees worked an average of 20 days per month (holidays and vacations accounted for the remaining 2 to 3 days per month).
Step by Step Answer:


Management Accounting Information for Decision-Making and Strategy Execution
ISBN: 978-0137024971
6th Edition
Authors: Anthony A. Atkinson, Robert S. Kaplan, Ella Mae Matsumura, S. Mark Young
