

A college student is interested in how many friends the average person has. She decides to count
Question:
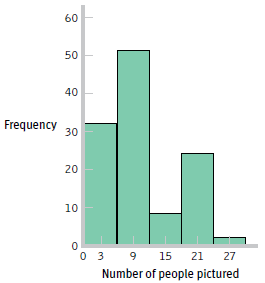
a. What kind of visual display is this?
b. Estimate how many people have fewer than 6 people pictured.
c. Estimate how many people have more than 18 people pictured.
d. Can you think of additional questions you might ask after reviewing the data displayed here?
e. Below is a subset of the data described here. Create a grouped frequency table for these data, using seven groupings.
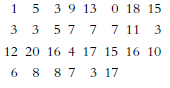
f. Create a histogram of the grouped data from (e).
g. Describe how the data depicted in the original graph and the histogram you created in part (f) are distributed.
Fantastic news! We've Found the answer you've been seeking!
Step by Step Answer:
a A histogram of grouped frequencies b Approximately 32 c Approximately 27 d Two q...View the full answer

Answered By
GERALD KAMAU
non-plagiarism work, timely work and A++ work
6+ Reviews
11+ Question Solved
Related Book For 

Essentials Of Statistics For The Behavioral Sciences
ISBN: 9781464107771
3rd Edition
Authors: Susan A. Nolan
Question Posted:
