

U.S. News & World Report publishes acceptance rates for U.S. universities. Following are the acceptance rates f
Question:
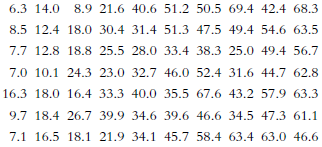
a. Create a grouped frequency table for these data.
b. The data have quite a range, with the highest acceptance rates among the top 70 belonging to Yeshiva University in New York, and the lowest belonging to Harvard University. What research hypotheses come to mind when you examine these data? State at least one research question that these data suggest to you.
c. Create a grouped histogram for these data. Be careful when determining the midpoints of your intervals!
d. Create a frequency polygon for these data.
e. Examine these graphs and give a brief description of the distribution. Are there unusual scores? Are the data skewed, and if so, in which direction?
Fantastic news! We've Found the answer you've been seeking!
Step by Step Answer:
a b There are many possible answers to this question For example we might ask whet...View the full answer

Answered By
Aysha Ali
my name is ayesha ali. i have done my matriculation in science topics with a+ . then i got admission in the field of computer science and technology in punjab college, lahore. i have passed my final examination of college with a+ also. after that, i got admission in the biggest university of pakistan which is university of the punjab. i am studying business and information technology in my university. i always stand first in my class. i am very brilliant client. my experts always appreciate my work. my projects are very popular in my university because i always complete my work with extreme devotion. i have a great knowledge about all major science topics. science topics always remain my favorite topics. i am also a home expert. i teach many clients at my home ranging from pre-school level to university level. my clients always show excellent result. i am expert in writing essays, reports, speeches, researches and all type of projects. i also have a vast knowledge about business, marketing, cost accounting and finance. i am also expert in making presentations on powerpoint and microsoft word. if you need any sort of help in any topic, please dont hesitate to consult with me. i will provide you the best work at a very reasonable price. i am quality oriented and i have 5 year experience in the following field.
matriculation in science topics; inter in computer science; bachelors in business and information technology
_embed src=http://www.clocklink.com/clocks/0018-orange.swf?timezone=usa_albany& width=200 height=200 wmode=transparent type=application/x-shockwave-flash_
11+ Reviews
14+ Question Solved
Related Book For 

Essentials Of Statistics For The Behavioral Sciences
ISBN: 9781464107771
3rd Edition
Authors: Susan A. Nolan
Question Posted:
