

The National Transportation Safety Board collects data by state (including the District of Columbia) on traffic fatalities.
Question:
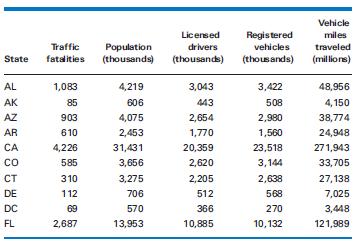
The National Transportation Safety Board collects data by state (including the District of Columbia) on traffic fatalities. Part of this data is shown in the following table, along with potentially related factors including population, number of licensed drivers, number of registered vehicles, and total number of vehicle miles driven. You have been asked to develop a model to help explain the factors that underlie traffic fatalities.
a. Build a linear model to predict traffic fatalities based on all four potential explanatory variables as they are measured in the table. Evaluate the model in terms of overall goodness-of-fit. Evaluate the results for each regression parameter: Are the signs appropriate? Are the values different from zero?
b. Can you improve the model in (a) by removing one or more of the explanatory variables from the regression? If so, compare the advantages and disadvantages of the resulting regression from the one in (a).
c. Can you improve the models in (a) or (b) by transforming one or more of the explanatory variables from the regression? If so, compare the advantages and disadvantages of the resulting regression from the ones in (a) and (b).
Step by Step Answer:
Solution a The results entails one regression equation logFatalities 01164 04...View the full answer


Management Science The Art Of Modeling With Spreadsheets
ISBN: 9780470530672
3rd Edition
Authors: Stephen G. Powell, Kenneth R. Baker
