Consider the following data related to the financial performance of Royal Company: Between 2018 and 2021, income
Question:
Consider the following data related to the financial performance of Royal Company:
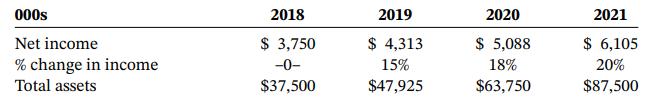
Between 2018 and 2021, income increased by 63 percent, showing a significant increase in income each year. In light of this performance, the board of directors has awarded large bonuses to senior executives. However, the stock price has fallen from $73 per share in 2018 to $56 per share at the end of 2021.
Required
a. Calculate ROI for each year. To simplify the calculation, assume that there is no interest expense and there are no noninterest-bearing current liabilities (thus, net income equals NOPAT and total assets are a reasonable measure of investment).
b. Explain why the stock price has dropped and why rewarding managers based on increases in profit can lead to overinvestment.
c. Calculate economic value added for 2018 to 2021, using a cost of capital (required return) of 9.5 percent. Does performance measured in terms of EVA help explain the decline in stock price?
Step by Step Answer:
a In 000s 201 8 201 9 20 20 20 21 Net income 3750 4313 5088 6105 Total assets 37500 47925 63750 8750...View the full answer