

Ken Howard, financial analyst at JVR Corporation, a manufacturer of precision parts, is examining the behaviour of
Question:
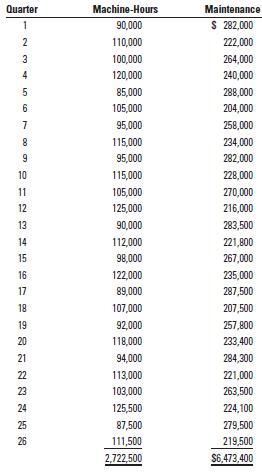
Ken Howard, financial analyst at JVR Corporation, a manufacturer of precision parts, is examining the behaviour of quarterly maintenance costs for budgeting purposes. Howard collects data on machine-hours worked and maintenance costs for the past 26 quarters. The data are as follows:
Required
1. a. Using Excel, do a regression analysis to estimate and plot the quarterly data underlying the cost function: Maintenance costs y = a + b X + e (where X = 100,000 direct machine-hours).
b. Estimate the cost function for the data represented by the plots in requirement 1a using the high–low method.
c. How well does each cost function fit the data?
2. a. After considering the accounting cycle, Howard realizes that maintenance costs are not even invoiced to the company until the month following the completion of the work. Work done at the end of March will not be invoiced and paid until April. This delays payment of the cost of maintenance completed in quarter 1 into quarter 2, when the payment is recorded in the maintenance cost pool. Howard then uses Excel to complete an OLS regression to estimate and plot the quarterly data relating machine-hours in a quarter (such as t ) to maintenance costs in the following quarter ( t + 1). That is, plot machine-hours in quarter 1 against maintenance costs in quarter 2, machine-hours in quarter 2 against maintenance costs in quarter 3, and so on.
b. Estimate the cost function for the data represented by the plots in requirement 2a using the high low method.
c. How well does each cost function fit the data?
Step by Step Answer:
Based on the provided data I can guide you through the steps necessary to analyze it using Excel and the highlow method but Im unable to execute the regression analysis or create plots for you since t...View the full answer


Cost Accounting A Managerial Emphasis
ISBN: 978-0133138443
7th Canadian Edition
Authors: Srikant M. Datar, Madhav V. Rajan, Charles T. Horngren, Louis Beaubien, Chris Graham
