

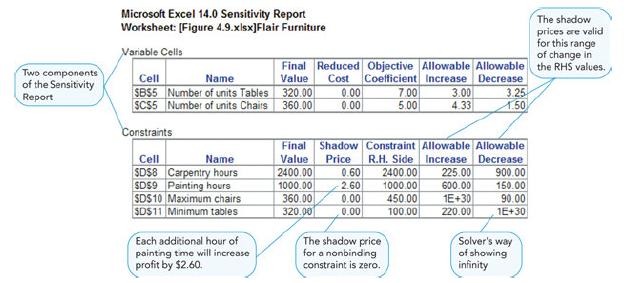
Consider Figure 4.11, which shows the Sensitivity Report for the Flair Furniture Company example in Section 4.3.
Question:
Consider Figure 4.11, which shows the Sensitivity Report for the Flair Furniture Company example in Section 4.3. By examining this figure and the LP formulation, can you compute by hand the optimal product mix if carpentry hours increase by 200 units? If so, what is the answer?
Figure 4.11
Fantastic news! We've Found the answer you've been seeking!
Step by Step Answer:
To compute the optimal product mix when carpentry hours increase by 200 units we need to analyze the sensitivity report and make adjustments based on ...View the full answer

Answered By
Salome Wambui
EDUCATION
Bachelor of Science in Applied Statistics, University of Maseno
TUTORING EXPERIENCE
• Tutored college-level students in introductory and advanced topics in Statistics, including probability, hypothesis testing, regression, and ANOVA
• Assisted elementary, middle, and high school students with math and science courses, including Algebra, Geometry, and Calculus
• Led guided review sessions to prepare students for exams in Statistics, Math, and Science
• Mentored students on problem-solving, study skills, and time-management strategies to help them succeed in their classes
0 Reviews
10+ Question Solved
Related Book For 
Managerial Decision Modeling Business Analytics With Spreadsheet
ISBN: 9781501515101
4th Edition
Authors: Nagraj Balakrishnan, Barry Render, Ralph Stair, Charles Munson
Question Posted:
