

The figure below shows demand, marginal revenue, and short-run cost curves for a monopoly: a. How much
Question:
The figure below shows demand, marginal revenue, and short-run cost curves for a monopoly: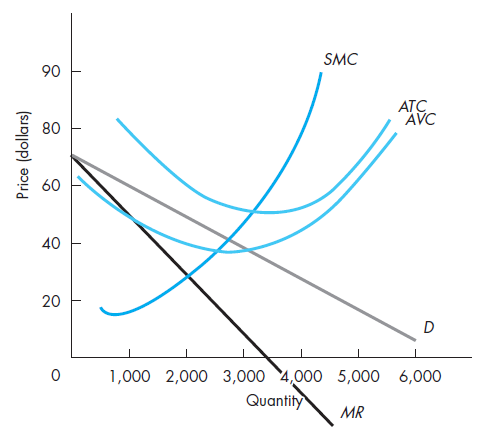
a. How much should the firm produce? What price should it charge?b. What is the firm?s profit (loss)?c. What is total revenue? What is total variable cost?d. If the firm shuts down in the short run, how much will it lose?
Fantastic news! We've Found the answer you've been seeking!
Step by Step Answer:
We know in Monopoly the profit maximization condition MR MC So when ...View the full answer

Answered By
Abhishek Awana
I completed my graduation in 2016 and post graduation in 2018. I give home tution to student. I teach economics to the students.
0 Reviews
10+ Question Solved
Related Book For 

Managerial Economics Foundations of Business Analysis and Strategy
ISBN: 978-0078021909
12th edition
Authors: Christopher Thomas, S. Charles Maurice
Question Posted:
