

Determine whether the data in each of the graphs provided would result in a negative or positive
Question:
Determine whether the data in each of the graphs provided would result in a negative or positive correlation coefficient.
a.
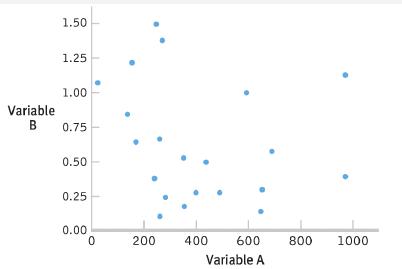
Description
The data are as follows. Variable A is represented along the horizontal axis and its values range from 0 to 1000 in increments of 200. Variable B is represented along the vertical axis and its values range from 0.00 to 1.50 in increments of 0.25. The plotted points are listed as follows. (0.1, 1.01), (180, 0.76), (190, 0.56), (210, 0.23), (250, 0.25), (210, 0.26), (210, 0.74), (210, 1.30), (210, 1.50), (390, 0.24), (400, 0.25), (390, 0.50), (410, 0.49), (450, 0.25), (620, 0.23), (620, 0.25), (650, 0.60), (600, 1.00), (990, 0.48), and (990, 1.23).
All data are approximate.
b.
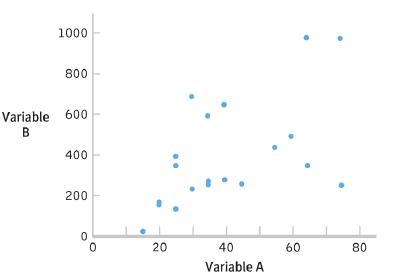
Description
The data are as follows. Variable A is represented along the horizontal axis and its values range from 0 to 80, in increments of 20. Variable B is represented along the vertical axis and its values range from 0 to 1000 in increments of 200. The plotted points are listed as follows. (17, 0), (20, 180), (20, 190), (25, 150), (30, 200), (25, 390), (25, 400), (30, 700), (35, 210), (35, 220), (35, 600), (40, 250), (40, 650), (45, 250), (55, 410), (60, 500), (65, 580), (65, 980), (62, 390), (75, 230), and (75, 980).
c.
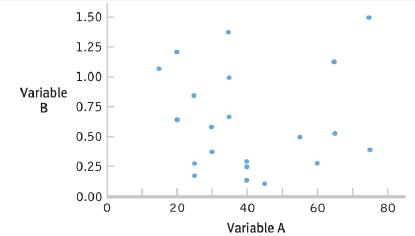
Description
The data are as follows. Variable A is represented along the horizontal axis and its values range from 0 to 80 in increments of 20. Variable B is represented along the vertical axis and its values range from 0.00 to 1.50 in increments of 0.25. The plotted points are listed as follows. (25, 0.23), (25, 0.25), (20, 0.60), (15, 1.10), (20, 1.25), (25, 0.60), (30, 0.30), (30, 0.60), (35, 0.65), (35, 1.00), (35, 1.30), (40, 0.23), (40, 0.25), (40, 0.24), (45, 0.23), (60, 0.27), (55, 0.50), (65, 0.50), (65, 1.23), (75, 0.23), and (80, 1.50).
Step by Step Answer:
To determine whether the data in each of the graphs would result in a negative or positive correlati...View the full answer


Statistics For The Behavioral Sciences
ISBN: 9781319190743
5th Edition
Authors: Susan A. Nolan, Thomas Heinzen
