

Assume that costs and expenses for Continental Divide Mining can be modeled by C(t) = - 0.012t
Question:
Assume that costs and expenses for Continental Divide Mining can be modeled by
C(t) = - 0.012t2 + 0.492t + 0.725
where t is the number of years past 2007.
(a) Use R(t) as given in Problem 20 and form the profit function (as a function of time).
(b) Use the function from (a) to find the year in which maximum profit occurs.
(c) Graph the profit function from (a) and the data points from the table.
(d) Through the decade from 2015 to 2025, does the function project increasing or decreasing profits? Do the data support this trend (as far as it goes)?
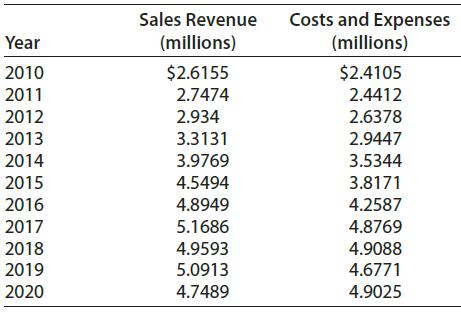
The data in the table give sales revenues and costs and expenses for Continental Divide Mining for various years.
Step by Step Answer:
a b c d The model projects d...View the full answer


Mathematical Applications For The Management, Life And Social Sciences
ISBN: 9781337625340
12th Edition
Authors: Ronald J. Harshbarger, James J. Reynolds
