

For selected years from 1985 and projected to 2035, the following table shows the U.S. energy use
Question:
For selected years from 1985 and projected to 2035, the following table shows the U.S. energy use per dollar of GDP, viewed as a percent of the 1980 usage. Thus, in 2000, U.S. energy use per dollar of GDP was 67% of what it was in 1980. Suppose the rate of change of energy use per dollar of GDP can be modeled by
dE/dt = 0.00468(0.4t + 2)2 - 0.104(0.4t + 2) - 0.56
percentage points per year, where t is the number of years past 1980.
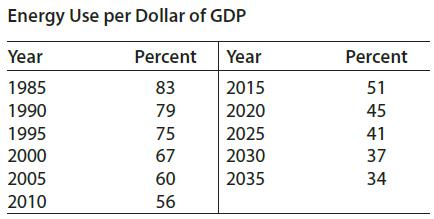
(a) Use integration and the data point for 1990 to find the function E(t) that models the energy use per dollar of GDP. Use 2 significant digits.
(b) Graph the model from part (a) with the data in the table.
(c) Find the model’s predicted energy use per dollar of GDP in 2025.
Step by Step Answer:
dEdt 00046804t 2 2 010404t 2 056 a b c E45 42 E t 000468 04t 2 010404t2056 ...View the full answer


Mathematical Applications For The Management, Life And Social Sciences
ISBN: 9781337625340
12th Edition
Authors: Ronald J. Harshbarger, James J. Reynolds
