

Projections indicate that the percent of U.S. adults with diabetes will dramatically increase. The table gives the
Question:
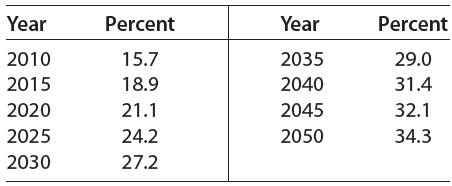
Projections indicate that the percent of U.S. adults with diabetes will dramatically increase. The table gives the percent of U.S. adults with diabetes for selected years from 2010 and projected to 2050.
(a) Find a logarithmic model, y = f (x), for these data. Use x as the number of years after 2000.
(b) Find the function that models the rate of change of the percent of U.S. adults with diabetes.
(c) Find and interpret f (25) and f'(25).
Fantastic news! We've Found the answer you've been seeking!
Step by Step Answer:
a y 11851lnx 1297...View the full answer

Answered By
Stacy kosgei
I offer quality, original and timely services; Highly credible and void of plagiarism. Your success is my pleasure.
2+ Reviews
10+ Question Solved
Related Book For 

Mathematical Applications For The Management, Life And Social Sciences
ISBN: 9781337625340
12th Edition
Authors: Ronald J. Harshbarger, James J. Reynolds
Question Posted:
