

The aged dependency ratio, the ratio of the U.S. population ages 65 or over to that of
Question:
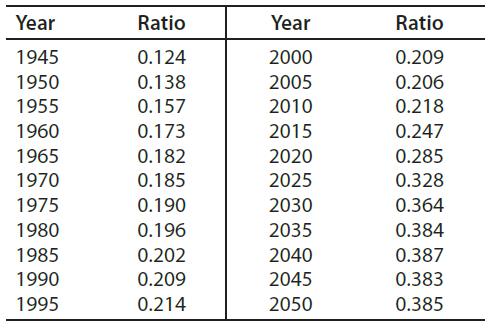
The aged dependency ratio, the ratio of the U.S. population ages 65 or over to that of ages 20–64, can be used to estimate the number of Medicare enrollees per worker. The following table shows Social Security Administration data for this ratio every 5 years from 1945 and projected to 2050. Construct a frequency histogram for these ratios using intervals of width 0.05.
Fantastic news! We've Found the answer you've been seeking!
Step by Step Answer:
fx 10 8 ...View the full answer

Answered By
Emel Khan
I have the ability to effectively communicate and demonstrate concepts to students. Through my practical application of the subject required, I am able to provide real-world examples and clarify complex ideas. This helps students to better understand and retain the information, leading to improved performance and confidence in their abilities. Additionally, my hands-on approach allows for interactive lessons and personalized instruction, catering to the individual needs and learning styles of each student.
2+ Reviews
10+ Question Solved
Related Book For 

Mathematical Applications For The Management, Life And Social Sciences
ISBN: 9781337625340
12th Edition
Authors: Ronald J. Harshbarger, James J. Reynolds
Question Posted:
