

The figure shows a barograph readout of the barometric pressure as recorded by Georgia Southern Universitys meteorological
Question:
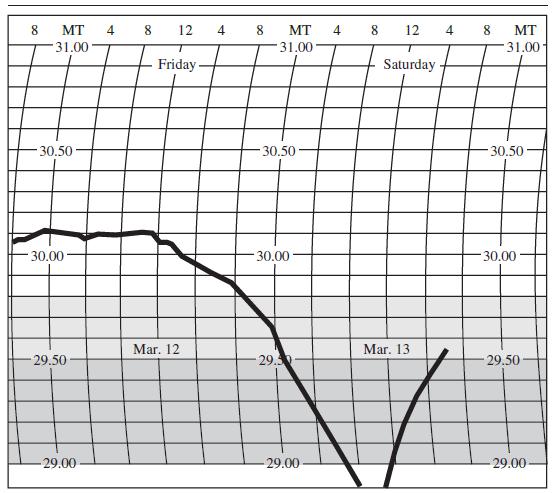
The figure shows a barograph readout of the barometric pressure as recorded by Georgia Southern University’s meteorological equipment. The figure shows a tremendous drop in barometric pressure on March 13, 1993.
(a) If B(t) is barometric pressure expressed as a function of time, as shown in the figure, did B(t) have a vertical asymptote sometime after 8 a.m. on March 13, 1993? Explain why or why not.
(b) Consult Google or another search engine to find out what happened in Georgia (and in the eastern United States) on March 13, 1993, to cause such a dramatic drop in barometric pressure.
Fantastic news! We've Found the answer you've been seeking!
Step by Step Answer:
a No Barometric pressure can drop off the sc...View the full answer

Answered By
Pushpinder Singh
Currently, I am PhD scholar with Indian Statistical problem, working in applied statistics and real life data problems. I have done several projects in Statistics especially Time Series data analysis, Regression Techniques.
I am Master in Statistics from Indian Institute of Technology, Kanpur.
I have been teaching students for various University entrance exams and passing grades in Graduation and Post-Graduation.I have expertise in solving problems in Statistics for more than 2 years now.I am a subject expert in Statistics with Assignmentpedia.com.
3+ Reviews
10+ Question Solved
Related Book For 

Mathematical Applications For The Management, Life And Social Sciences
ISBN: 9781337625340
12th Edition
Authors: Ronald J. Harshbarger, James J. Reynolds
Question Posted:
