

The following table gives the U.S. population, ages 2064, (in millions) for selected years from 1950 and
Question:
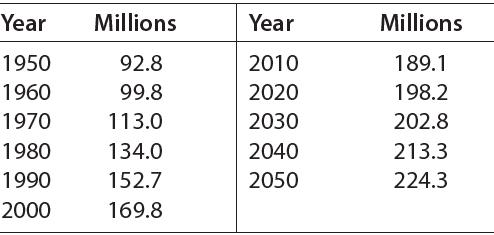
The following table gives the U.S. population, ages 20–64, (in millions) for selected years from 1950 and projected to 2050.
(a) Find the logistic function that models these data. Use x as the number of years after 1950 and report your model with 3 significant digit coefficients.
(b) Use the unrounded model to predict the U.S. population ages 20–64 in 2025.
(c) When does the unrounded model predict this group’s population will reach 210 million?
Fantastic news! We've Found the answer you've been seeking!
Step by Step Answer:
a yx 251 1 192e 00273x b y 75 2014 ...View the full answer

Answered By
Brown Arianne
Detail-oriented professional tutor with a solid 10 years of experience instilling confidence in high school and college students. Dedicated to empowering all students with constructive feedback and practical test-taking strategies. Effective educator and team player whether working in a school, university, or private provider setting. Active listener committed to helping students overcome academic challenges to reach personal goals.
2+ Reviews
10+ Question Solved
Related Book For 

Mathematical Applications For The Management, Life And Social Sciences
ISBN: 9781337625340
12th Edition
Authors: Ronald J. Harshbarger, James J. Reynolds
Question Posted:
