

The following table gives the value (in billions of dollars) of U.S. industrial shipments for selected years
Question:
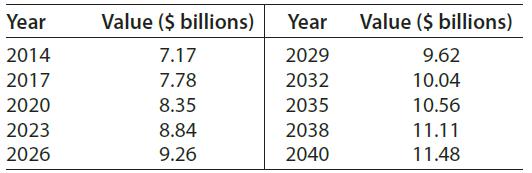
The following table gives the value (in billions of dollars) of U.S. industrial shipments for selected years from 2014 and projected to 2040.
(a) Find a cubic function that models these data, with x as the number of years after 2010 and y as the billions of dollars of U.S. industrial shipments. Report your model with two significant digit coefficients.
(b) Use the reported model to find the point at which the rate of change of the value of U.S. industrial shipments begins to increase.
(c) Interpret the result found in part (b).
(d) What feature of the graph corresponds to the point found in part (b)?
Fantastic news! We've Found the answer you've been seeking!
Step by Step Answer:
a y 000018x 3 00097x 2 030x 61 b c d The model predicts that ...View the full answer

Answered By
Rohith Bellamkonda
I am studying in IIT Indore,the most prestigious institute of India.I love solving maths and enjoy coding
1+ Reviews
10+ Question Solved
Related Book For 

Mathematical Applications For The Management, Life And Social Sciences
ISBN: 9781337625340
12th Edition
Authors: Ronald J. Harshbarger, James J. Reynolds
Question Posted:
