

The following table shows the amount spent per person for health care in the United States for
Question:
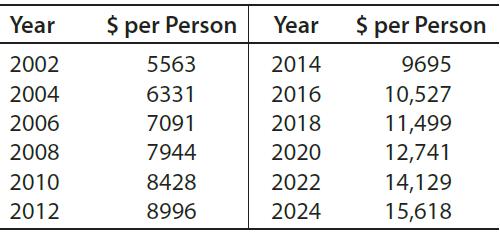
The following table shows the amount spent per person for health care in the United States for selected years from 2002 and projected to 2024. These data can be modeled by
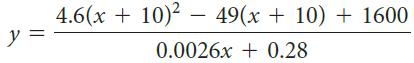
where x is the number of years after 2000 and y is per capita expenditures for health care.
(a) Find the instantaneous rate of change of per capita health care expenditures (to the nearest dollar) for 2010 and 2020.
(b) Interpret the rate of change for 2020 found in part (a).
(c) Use the data to find the average rate of change from 2018 to 2020. How well does this approximate the rate of change in 2020?
Fantastic news! We've Found the answer you've been seeking!
Step by Step Answer:
a Let dx be the denominator of yx Let nx be the numerator of yx The year 2010 c...View the full answer

Answered By
PALASH JHANWAR
I am a Chartered Accountant with AIR 45 in CA - IPCC. I am a Merit Holder ( B.Com ). The following is my educational details.
PLEASE ACCESS MY RESUME FROM THE FOLLOWING LINK: https://drive.google.com/file/d/1hYR1uch-ff6MRC_cDB07K6VqY9kQ3SFL/view?usp=sharing
3+ Reviews
10+ Question Solved
Related Book For 

Mathematical Applications For The Management, Life And Social Sciences
ISBN: 9781337625340
12th Edition
Authors: Ronald J. Harshbarger, James J. Reynolds
Question Posted:
