

The following table shows the U.S. average annual wage in thousands of dollars for selected years from
Question:
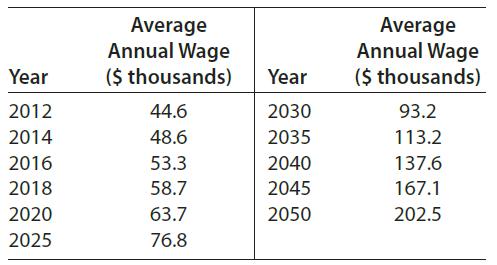
The following table shows the U.S. average annual wage in thousands of dollars for selected years from 2012 and projected to 2050. Suppose the rate of change of the U.S. average annual wage can be modeled by dW/dt = 1.66e0.0395t thousand dollars per year, where t is the number of years past 2010.
(a) Use the data to find the average rates of change of the U.S. average annual wage from 2014 to 2016 and from 2016 to 2018. Which of these average rates better approximates the instantaneous rate in 2016?
(b) Use the data point from 2016 to find the function that models W(t). Use 3 significant digits.
Fantastic news! We've Found the answer you've been seeking!
Step by Step Answer:
dW dt 166e 00395t a Avg rate for 20142016 533 4862016 ...View the full answer

Answered By
David Ngaruiya
i am a smart worker who concentrates on the content according to my clients' specifications and requirements.
7+ Reviews
19+ Question Solved
Related Book For 

Mathematical Applications For The Management, Life And Social Sciences
ISBN: 9781337625340
12th Edition
Authors: Ronald J. Harshbarger, James J. Reynolds
Question Posted:
