

The graph in the following figure shows the projected federal spending for Medicare as a percent of
Question:
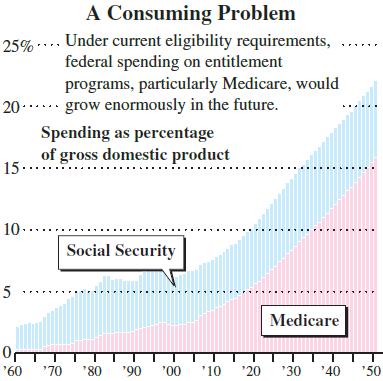
The graph in the following figure shows the projected federal spending for Medicare as a percent of the gross domestic product. If these expenditures were modeled as a function of time, which of a growth exponential, a decay exponential, or a logarithm would be the best model? Justify your answer.
Fantastic news! We've Found the answer you've been seeking!
Step by Step Answer:
Growth exponentia...View the full answer

Answered By
Nyron Beeput
I am an active educator and professional tutor with substantial experience in Biology and General Science. The past two years I have been tutoring online intensively with high school and college students. I have been teaching for four years and this experience has helped me to hone skills such as patience, dedication and flexibility. I work at the pace of my students and ensure that they understand.
My method of using real life examples that my students can relate to has helped them grasp concepts more readily. I also help students learn how to apply their knowledge and they appreciate that very much.
1+ Reviews
10+ Question Solved
Related Book For 

Mathematical Applications For The Management, Life And Social Sciences
ISBN: 9781337625340
12th Edition
Authors: Ronald J. Harshbarger, James J. Reynolds
Question Posted:
