

The table gives the percent of men 65 years or older in the workforce for selected years
Question:
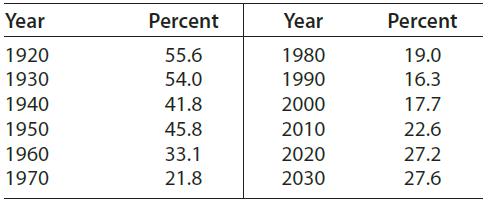
The table gives the percent of men 65 years or older in the workforce for selected years from 1920 and projected to 2030.
(a) With x as the number of years after 1900, find the cubic function that models these data. Report the model with three significant digits.
(b) Use the reported model to determine when the rate of change of the percent of elderly men in the workforce reached its minimum.
(c) On the graph of this model, to what does the result in part (b) correspond?
Fantastic news! We've Found the answer you've been seeking!
Step by Step Answer:
a y 00000778x 3 00107x2 0182x 647 b The rate of change of the per...View the full answer

Answered By
Wonder Dzidzormenu
As a professional accountant and a teacher, I explain account ing concepts in a more practical way that makes students more connected to the subject.
With over 10 years of teaching accounting , I offer a well constructed , easily understood and in-depth explanations to students questions.
1+ Reviews
10+ Question Solved
Related Book For 

Mathematical Applications For The Management, Life And Social Sciences
ISBN: 9781337625340
12th Edition
Authors: Ronald J. Harshbarger, James J. Reynolds
Question Posted:
