

The table gives the projected 2020 population of the United States. (a) Use the class marks and
Question:
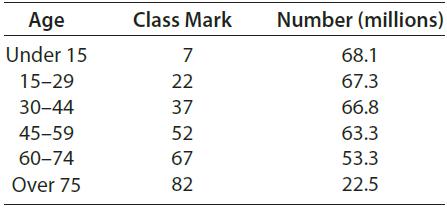
The table gives the projected 2020 population of the United States.
(a) Use the class marks and the given number (frequency) in each class to find the mean age.
(b) In third world countries where the birth rate is higher and the life span is shorter, which group—under 30, 30–59, or 60 and over—would be most likely to be the smallest? How would this affect a third world country’s mean age relative to that of the United States?
Fantastic news! We've Found the answer you've been seeking!
Step by Step Answer:
a b 60 or over would likely be the ...View the full answer

Answered By
Emel Khan
I have the ability to effectively communicate and demonstrate concepts to students. Through my practical application of the subject required, I am able to provide real-world examples and clarify complex ideas. This helps students to better understand and retain the information, leading to improved performance and confidence in their abilities. Additionally, my hands-on approach allows for interactive lessons and personalized instruction, catering to the individual needs and learning styles of each student.
2+ Reviews
10+ Question Solved
Related Book For 

Mathematical Applications For The Management, Life And Social Sciences
ISBN: 9781337625340
12th Edition
Authors: Ronald J. Harshbarger, James J. Reynolds
Question Posted:
