

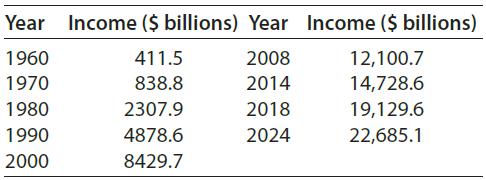
The table shows the total personal income in the United States (in billions of dollars) for selected
Question:
The table shows the total personal income in the United States (in billions of dollars) for selected years from 1960 and projected to 2024.
(a) These data can be modeled by an exponential function. Write the equation of this function, with x equal to the number of years after 1960. Report the model with 4 significant digits.
(b) Does the unrounded model overestimate or underestimate the total personal income given in the table for 2018?
(c) Graphically determine the year the model predicts total personal income will reach $34 trillion.
Fantastic news! We've Found the answer you've been seeking!
Step by Step Answer:
a Letting x 0 correspond to the year 1960 enter the ...View the full answer

Answered By
Geoffrey Isaboke
I am an industrious tutor with a 5-yr experience in professional academic writing. I have passion for History and Music and I have good knowledge in Economics
2+ Reviews
10+ Question Solved
Related Book For 

Mathematical Applications For The Management, Life And Social Sciences
ISBN: 9781337625340
12th Edition
Authors: Ronald J. Harshbarger, James J. Reynolds
Question Posted:
