

The table shows U.S. gross domestic product (GDP) in billions of dollars for selected years from 2000
Question:
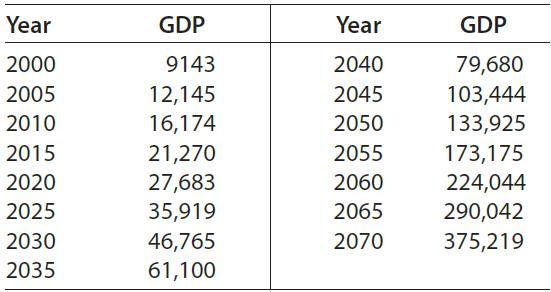
The table shows U.S. gross domestic product (GDP) in billions of dollars for selected years from 2000 to 2070 (actual and projected).
Assume that the GDP can be modeled with the function
G(t) = 213(0.2t + 5)3 - 5020(0.2t + 5)2 + 8810t + 104,000
where G(t) is in billions of dollars and t is the number of years past 2000.
(a) Use the model to find and interpret the instantaneous rates of change of the GDP in 2015 and 2025.
(b) Use the data in the table to find the average rate of change of the GDP from 2015 to 2025.
(c) How well does your answer from part (b) approximate the instantaneous rate of change of GDP in 2020?
Fantastic news! We've Found the answer you've been seeking!
Step by Step Answer:
a b The average rate of change in the GDP between 15 and ...View the full answer

Answered By
Muhammad Umair
I have done job as Embedded System Engineer for just four months but after it i have decided to open my own lab and to work on projects that i can launch my own product in market. I work on different softwares like Proteus, Mikroc to program Embedded Systems. My basic work is on Embedded Systems. I have skills in Autocad, Proteus, C++, C programming and i love to share these skills to other to enhance my knowledge too.
1+ Reviews
10+ Question Solved
Related Book For 

Mathematical Applications For The Management, Life And Social Sciences
ISBN: 9781337625340
12th Edition
Authors: Ronald J. Harshbarger, James J. Reynolds
Question Posted:
