

Demand and supply often shift in the retail market for gasoline. Here are two demand curves and
Question:
Demand and supply often shift in the retail market for gasoline. Here are two demand curves and two supply curves for gallons of gasoline in the month of May in a small town in Maine. Some of the data is missing.
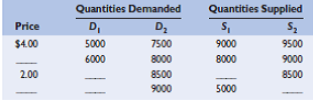
a. Use the following facts to fill in the missing data in the table. If demand is D1 and supply is S1 , the equilibrium quantity is 7000 gallons per month. When demand is D2 and supply is S1 , the equilibrium price is $3.00 per gallon. When demand is D2 and supply is S1 , there is an excess demand of 4000 gallons per month at a price of $1.00 per gallon. If demand is D1 and supply is S2 , the equilibrium quantity is 8000 gallons per month.
b. Compare two equilibriums. In the first, demand is D1 and supply is S1 . In the second, demand is D1 and supply is S2 . By how much does the equilibrium quantity change? By how much does the equilibrium price change?
c. If supply falls from S2 to S1 while demand declines from D2 to D1 , does the equilibrium price rise, fall, or stay the same? What if only supply falls? What if only demand falls?
d. Suppose that supply is fixed at S1 and that demand starts at D1 . By how many gallons per month would demand have to increase at each price level such that the equilibrium price per gallon would be $3.00? $4.00?
Step by Step Answer:
a See the complete table below for the missing values b equilibrium quantity increases by 1000 gallons per month the equilibrium prices falls by 100 c equilibrium price stays the same at 200 equilibri...View the full answer


Microeconomics Principles, Problems and Policies
ISBN: 978-1259450242
20th edition
Authors: Campbell R. McConnell, Stanley L. Brue, Sean Masaki Flynn
