

The diagram below shows the competitive market for gasoline in two island economies, Island Flatland and Island
Question:
The diagram below shows the competitive market for gasoline in two island economies, Island Flatland and Island Steephills, which have similar populations but have different elasticities of demand for the product. On each island a tax of $0.20 per litre of gasoline is imposed.
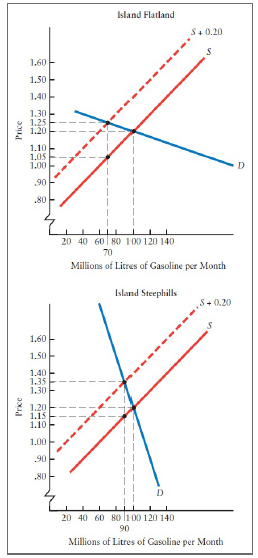
a. What is the producers? net revenue before imposition of the tax on each island (in dollars)? What is their net?revenue after imposition of the tax?
b. What is the direct burden of this tax on each island?
c. What is the excess burden of the tax on each island?
d. Is the tax more allocatively efficient on one island than another? How do you explain this?
Fantastic news! We've Found the answer you've been seeking!
Step by Step Answer:
a Producers net revenue before the tax is simply price times quantity which is 120 million per month ...View the full answer

Answered By
Morgan Njeri
Very Versatile especially in expressing Ideas in writings.
Passionate on my technical knowledge delivery.
Able to multitask and able to perform under pressure by handling multiple challenges that require time sensitive solution.
Writting articles and video editing.
Revise written materials to meet personal standards and satisfy clients demand.
Help Online Students with their course work.
12+ Reviews
38+ Question Solved
Related Book For 

Question Posted:
