

The diagram below shows the marginal cost of abatement of GHGs for each of two firms, LoCost
Question:
The diagram below shows the marginal cost of abatement of GHGs for each of two firms, LoCost Inc. and HiCost Inc. The government has imposed a direct regulatory control requiring each firm to abate 100 tonnes of GHGs.
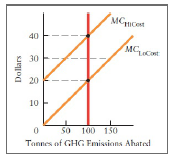
a. With the direct regulatory control in place, what is the MC of abatement for each firm?
b. In this situation, what is the total combined cost of abating 200 tonnes of GHGs? For each firm the total cost of abating X tonnes is given by the area under its MC curve up to X.
c. Now suppose the government replaces the direct regulatory control with a cap-and-trade system with the same total intended abatement. Emissions permits are issued to each firm. Suppose also that once trading in permits begins the equilibrium price is $30 per tonne.
With this policy in place, what is the marginal benefit the firms of abating one extra tonne of GHGs?
d. In this situation, explain which firm sells permits and why, and which firm purchases permits, and why. After trading, what is each firm?s MC of abatement?
e. With this cap-and-trade system in place, what is the total combined cost of abating the 200 tonnes of GHG emissions?
f. If you were advising the government, which pollutionreduction policy would you recommend it adopt, and why?
Step by Step Answer:
a With the regulatory control dictating that each firm abates 100 tonnes of GHGs the MC of abatement ...View the full answer


