

The figure below shows the supply curve for tennis balls, S 1, for Drop Volley tennis, a
Question:
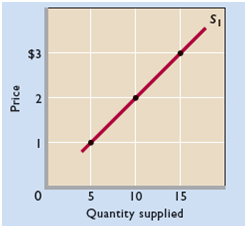
a. Use the figure to fill in the quantity supplied on supply curve S1 for each price in the table below.
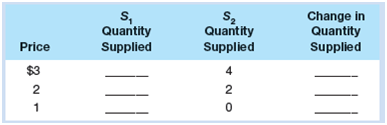
b. If production costs were to increase, the quantities supplied at each price would be as shown by the third column of the table (€œS2 Quantity Supplied€). Use that data to draw supply curve S2 on the same graph as supply curve S1.
c. In the fourth column of the table, enter the amount by which the quantity supplied at each price changes due to the increase in product costs. (Use positive numbers for increases and negative numbers for decreases.)
d. Did the increase in production costs cause a €œdecrease in supply€ or a €œdecrease in quantity supplied€?
Step by Step Answer:
a 15 balls at 3 10 balls at 2 5 balls at 1 b Draw in supply curve S 2 usi...View the full answer


Microeconomics Principles, Problems and Policies
ISBN: 978-1259450242
20th edition
Authors: Campbell R. McConnell, Stanley L. Brue, Sean Masaki Flynn
