

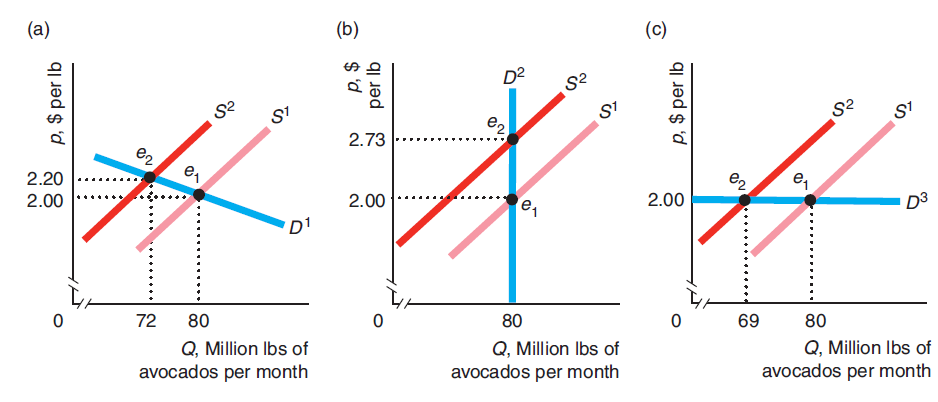
Using graphs similar to those in Figure 3.1, illustrate how the effect of a demand shock depends
Question:
Figure 3.1
Fantastic news! We've Found the answer you've been seeking!
Step by Step Answer:
The effect of a demand shock on quantity exchanged and the price depends on the shape of the su...View the full answer

Answered By
Mugdha Sisodiya
My self Mugdha Sisodiya from Chhattisgarh India. I have completed my Bachelors degree in 2015 and My Master in Commerce degree in 2016. I am having expertise in Management, Cost and Finance Accounts. Further I have completed my Chartered Accountant and working as a Professional.
Since 2012 I am providing home tutions.
2+ Reviews
10+ Question Solved
Related Book For 

Question Posted:
