

The graph in Figure 16.17 plots the number of customers in a queuing system with two servers.
Question:
The graph in Figure 16.17 plots the number of customers in a queuing system with two servers. The average processing time of each server is 400 seconds, with a standard deviation of 400 seconds. Customers wait in a single queue. Which of the following average interarrival times, a (in seconds), is consistent with the data observed in the graph?
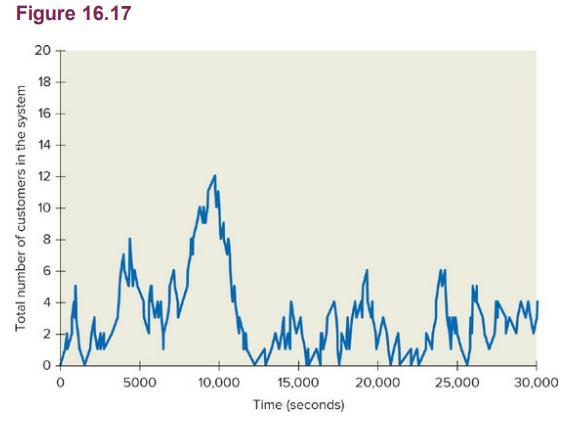
a. a = 50
b. a = 100
c. a = 150
d. a = 200
e. a = 250
f. All of the above average interarrival times are consistent with the graph.
g. None of the above average interarrival times are consistent with the graph.
h. It is not possible to determine which interarrival times are consistent with the graph.
Step by Step Answer:
e...View the full answer


Operations Management
ISBN: 9781260547610
2nd International Edition
Authors: Gerard Cachon, Christian Terwiesch
