

Which of the following lines in the graphs in Figure 16.16 best depicts the relationship between utilization
Question:
Which of the following lines in the graphs in Figure 16.16 best depicts the relationship between utilization and waiting time in a queuing system? (Assume the utilizations depicted are less than 100 percent.)
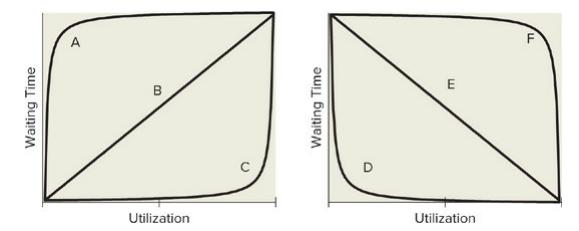
a. A
b. B
c. C
d. D
e. E
f. F
Fantastic news! We've Found the answer you've been seeking!
Step by Step Answer:

Answered By
Sita vyshnavi
i am still preparing for CA and i worked as junior lecturer for finance in junior college.
0 Reviews
10+ Question Solved
Related Book For 
Operations Management
ISBN: 9781260547610
2nd International Edition
Authors: Gerard Cachon, Christian Terwiesch
Question Posted:
