

Table F.5 gives the number of individuals who visit a tourist area by car and air over
Question:
Table F.5 gives the number of individuals who visit a tourist area by car and air over a 10-year period. Analyze the data from the standpoint of the applicability of the moving average technique.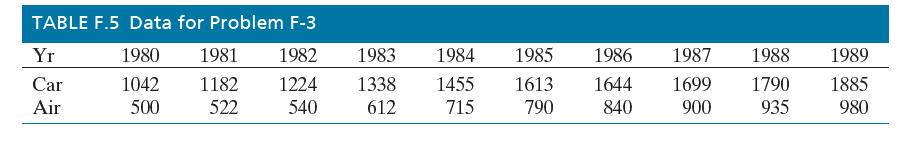
Fantastic news! We've Found the answer you've been seeking!
Step by Step Answer:
Data shows improvement trend n 3 for ...View the full answer

Answered By
Saud Ur Rehman
Evaluating manufacturing processes by designing and conducting research programs; applying knowledge of product design, fabrication, assembly, tooling, and materials; conferring with equipment vendors; soliciting observations from operators. Developing manufacturing processes by studying product requirements; researching, designing, modifying, and testing manufacturing methods and equipment; conferring with equipment vendors. Keeping equipment operational by coordinating maintenance and repair services; following manufacturer's instructions and established procedures; requesting special service.
1+ Reviews
10+ Question Solved
Related Book For 

Question Posted:
