

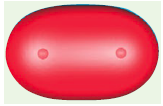
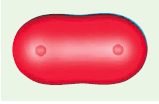
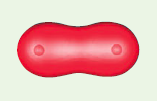
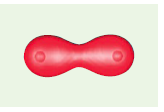
The following images show contours of constant electron density for H 2 calculated using the methods described
Question:
a.
b.
c.
d.
e.
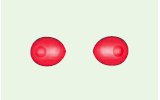
a. Explain why the apparent size of the H2 molecule as approximated by the volume inside the contour varies in the sequence a€“e.
b. Notice the neck that forms between the two hydrogen atoms in contours c and d. What does neck formation tell you about the relative density in the bonding region and in the region near the nuclei?
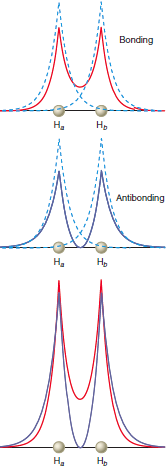
c. Explain the shape of the contours in image e by comparing this image with Figures 23.8 and 23.9.
d. Estimate the electron density in the bonding region midway between the H atoms by estimating the value of the electron density at which the neck disappears.
Figure 23.8
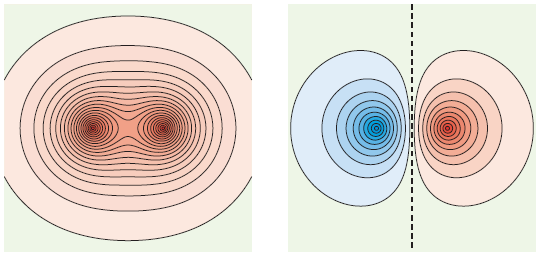
Figure 23.9
Fantastic news! We've Found the answer you've been seeking!
Step by Step Answer:
a The amplitude of the wave function and therefore the probability density fall...View the full answer

Answered By
Bhartendu Goyal
Professional, Experienced, and Expert tutor who will provide speedy and to-the-point solutions. I have been teaching students for 5 years now in different subjects and it's truly been one of the most rewarding experiences of my life. I have also done one-to-one tutoring with 100+ students and help them achieve great subject knowledge. I have expertise in computer subjects like C++, C, Java, and Python programming and other computer Science related fields. Many of my student's parents message me that your lessons improved their children's grades and this is the best only thing you want as a tea...
2+ Reviews
10+ Question Solved
Related Book For 

Question Posted:
