

Figure 13.17 showed a graph of log T versus log r for the planetary data given in
Question:
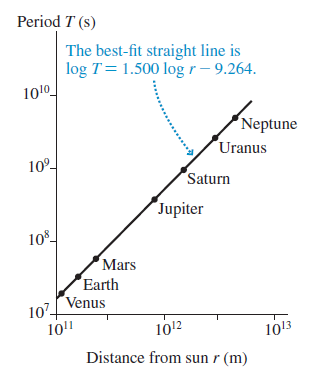
Figure 13.17 showed a graph of log T versus log r for the planetary data given in Table 13.2. Such a graph is called a log-log graph.The scales in Figure 13.17 are logarithmic, not linear, meaning that each division along the axis corresponds to a factor of 10 increase in the value. Strictly speaking, the ??correct?? labels on the y-axis should be 7, 8, 9, and 10 because these are the logarithms of 107,.......,1010.a. Consider two quantities u and v that are related by the expression vp= Cuq, where C is a constant. The exponents p and q are not necessarily integers. Define x = log u and y = log v. Find an expression for y in terms of x.b. What shape will a graph of y versus x have? Explain.c. What slope will a graph of y versus x have? Explain.d. Use the experimentally determined ??best-fit?? line in Figure 13.17 to find the mass of the sun.
Figure 13.17
Step by Step Answer:
Solve a Taking the logarithm of both sides of v p Cu q gives But x log u and y log v so x ...View the full answer


Physics for Scientists and Engineers A Strategic Approach with Modern Physics
ISBN: 978-0133942651
4th edition
Authors: Randall D. Knight
