

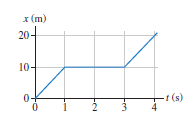
FIGURE EX2.5 shows the position graph of a particle. a. Draw the particles velocity graph for the
Question:
a. Draw the particle€™s velocity graph for the interval 0 s £ t £ 4 s.
b. Does this particle have a turning point or points? If so, at what time or times?
Figure Ex 2.5
Fantastic news! We've Found the answer you've been seeking!
Step by Step Answer:
a We can obtain the values for the velo...View the full answer

Answered By
Nyron Beeput
I am an active educator and professional tutor with substantial experience in Biology and General Science. The past two years I have been tutoring online intensively with high school and college students. I have been teaching for four years and this experience has helped me to hone skills such as patience, dedication and flexibility. I work at the pace of my students and ensure that they understand.
My method of using real life examples that my students can relate to has helped them grasp concepts more readily. I also help students learn how to apply their knowledge and they appreciate that very much.
1+ Reviews
10+ Question Solved
Related Book For 

Physics for Scientists and Engineers A Strategic Approach with Modern Physics
ISBN: 978-0133942651
4th edition
Authors: Randall D. Knight
Question Posted:
