

FIGURE Q25.6 shows the electric potential along the x-axis. a. Draw a graph of the potential energy
Question:
FIGURE Q25.6 shows the electric potential along the x-axis.
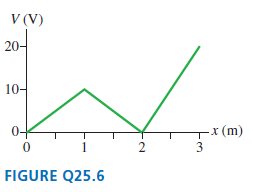 a. Draw a graph of the potential energy of a 0.1 C charged particle. Provide a numerical scale for both axes.b. If the charged particle is shot toward the right from x = 1 m with 1.0 J of kinetic energy, where is its turning point? Use your graph to explain.
Fantastic news! We've Found the answer you've been seeking!
Step by Step Answer:
a Note U qV b At the total energy ...View the full answer

Answered By
Saleem Abbas
Have worked in academic writing for an a years as my part-time job.
1+ Reviews
10+ Question Solved
Related Book For 

Physics for Scientists and Engineers A Strategic Approach with Modern Physics
ISBN: 978-0133942651
4th edition
Authors: Randall D. Knight
Question Posted:
