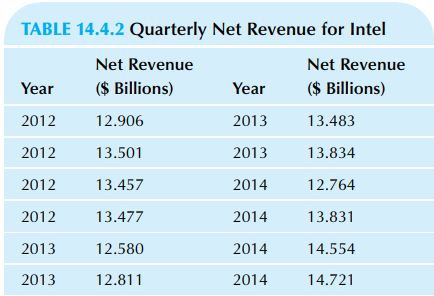
Consider Intels Net Revenue in Table 14.4.2. a. Construct a time-series plot for this data set. Describe
Question:
Consider Intel’s Net Revenue in Table 14.4.2.
a. Construct a time-series plot for this data set. Describe the seasonal and cyclic behavior that you see, as well as any evidence of irregular behavior.
b. Which quarter (1, 2, 3, or 4) appears to be Intel’s best in terms of net revenue, based on your plot in part a?
c. Is the seasonal pattern (in your graph for part a) consistent across the entire time period?
d. Calculate the moving average (using 1 year of data at a time) for this time series. Construct a time-series plot with both the data and the moving average.
e. Describe the cyclic behavior revealed by the moving average.
f. Find the seasonal index for each quarter. Do these values appear reasonable compared to the time-series plot of the data?
g. Find the seasonally adjusted sales corresponding to each of the original sales values. Construct a time-series plot of this seasonally adjusted series.
h. Do you see an overall linear long-term trend up or down throughout these sales data? Would it be appropriate to use a regression line for forecasting this series?
i. Intel’s revenue rose from 14.554 to 14.721 billion from the third to the fourth quarter of 2014. What happened to revenue on a seasonally adjusted basis?
Step by Step Answer:
a There is a fairly clear seasonal pattern with fourth quarter generally being the highest and first ...View the full answer