Consider the Walt Disney Companys quarterly revenues as shown in Table 14.4.1. a. Draw a time-series plot
Question:
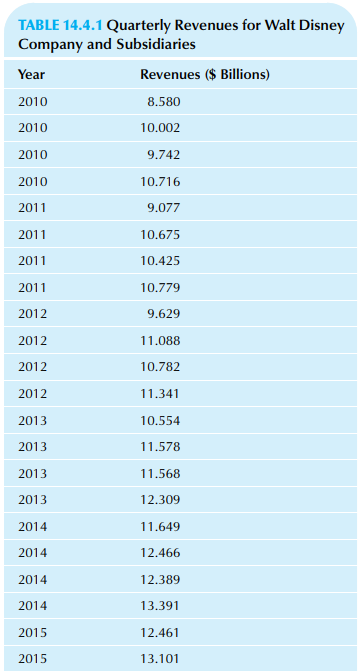
Consider the Walt Disney Company’s quarterly revenues as shown in Table 14.4.1.
a. Draw a time-series plot for this data set. Describe any trend and seasonal behavior that you see.
b. Find the moving average values and plot them on the same graph as the original data. Comment on what you see.
c. Find the seasonal index for each quarter. In particular, how much higher is the fourth quarter than a typical quarter during the year?
d. Find the seasonally adjusted values and plot them with the original data. Comment on what you see.
e. From fourth quarter 2014 to the first quarter of 2015, revenues fell from 13.391 to 12.461. What happened on a seasonally adjusted basis?
f. Find the regression equation to predict the long-term trend in seasonally adjusted sales for each time period, using 1, 2,… for the X variable.
g. Compute the seasonally adjusted forecast for the fourth quarter of 2017.
h. Compute the forecast for the first quarter of 2018.
Step by Step Answer:
a There appears to be an upward trend There is a seasonal pattern with revenues generally highest in ...View the full answer