

What problems, if any, are visible in the control charts in Fig. 18.5.5? What action (if any)
Question:
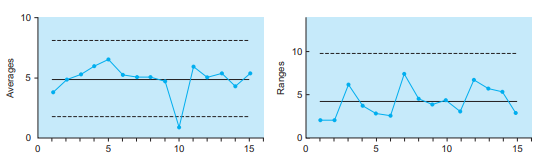
What problems, if any, are visible in the control charts in Fig. 18.5.5? What action (if any) would you suggest?
Fig 18.5.5
Fantastic news! We've Found the answer you've been seeking!
Step by Step Answer:
This process is not in control The c...View the full answer

Answered By
Geoffrey Isaboke
I am an industrious tutor with a 5-yr experience in professional academic writing. I have passion for History and Music and I have good knowledge in Economics
2+ Reviews
10+ Question Solved
Related Book For 
Question Posted:
