

A dotplot of the distribution of height for Mrs. Navards class is shown, along with some numerical
Question:
A dotplot of the distribution of height for Mrs. Navard’s class is shown, along with some numerical summaries of the data.
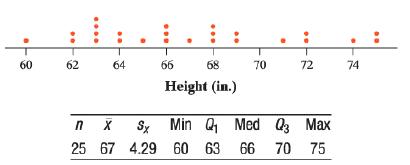
Suppose that Mrs. Navard has the entire class stand on a 6-inch-high platform and then asks the students to measure the distance from the top of their heads to the ground.
a. What shape would this distribution of distance have?
b. Find the mean and median of the distribution of distance.
c. Find the standard deviation and interquartile range (IQR) of the distribution of distance.
Fantastic news! We've Found the answer you've been seeking!
Step by Step Answer:
From the data plot we find that c But when a constant va...View the full answer

Answered By
Shivam Mishra
i have done my Masters (M.Sc. Physics with electronics) from M.J.P. Rohilkhand University and i was gold medalist in the university level. I craked CSIR NET , SET , JEST exams in Physics. Now i am doing Ph.D. in condensed matter physics from SNBNCBS Kolkata.
0 Reviews
10+ Question Solved
Related Book For 

Question Posted:
