

A random sample of 195 students was selected from the United Kingdom using the Census At School
Question:
A random sample of 195 students was selected from the United Kingdom using the Census At School data selector. The age x (in years) and height y (in centimeters) were recorded for each student. Here is a scatterplot with the least-squares regression line ŷ = 106.1 + 4.21x. For this model, s = 8.61 and r2 = 0.274.
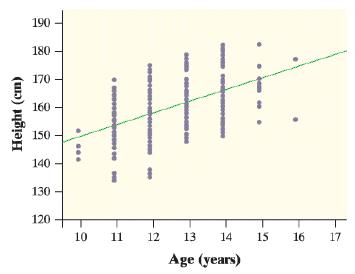
a. Calculate and interpret the residual for the student who was 141 cm tall at age 10.
b. Interpret the slope of the least-squares regression line.
c. Interpret the value of s.
d. Interpret the value of r2.
Fantastic news! We've Found the answer you've been seeking!
Step by Step Answer:
a Calculate and interpret the residual for the student who was 141 cm tall at age 10 y 1061 421x x a...View the full answer

Answered By
David Wafula
I have done statistics and programming for the past four years since I enrolled at the university and managed to get second class upper division. Solving statistical problems is my passion. i also enjoy doing statistical programming using R programming, Python and Stata. I can also use excel and spss to do statistics. Major areas where I do perfectly includes regression, data visualization, and testing hypotheses.
Besides doing what is entailed in my degree, I also do technical writing and essay writing on any given topic.
I can also write simple programs in python and c++
0 Reviews
10+ Question Solved
Related Book For 

Question Posted:
