

Here is a stemplot of the percent of residents aged 25 to 34 in each of the
Question:
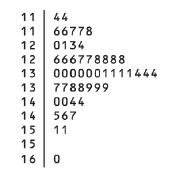
Here is a stemplot of the percent of residents aged 25 to 34 in each of the 50 states:
a. Why did we split stems?
b. Give an appropriate key for this stemplot.
c. Describe the shape of the distribution. Are there any outliers?
Fantastic news! We've Found the answer you've been seeking!
Step by Step Answer:
a We split stems in order to make the data easier to read and to organize the data in...View the full answer

Answered By
Ravi Tomar
I have 5 years of experience as an Agricultural Economics tutor. During this time, I have been able to successfully provide guidance to students in their studies and help them develop their knowledge and understanding of the subject. My approach to teaching has always been to combine academic learning with practical application, often drawing on my professional experience to help students better understand how the concepts they learn apply to the real world. I also focus on helping students develop critical thinking skills, enabling them to tackle problems independently and develop their own solutions. I have also been able to provide support on specific assignments, helping students to structure their work and ensure that it meets the required quality and standards.
0 Reviews
10+ Question Solved
Related Book For 

Question Posted:
