

If the distribution of absences was displayed in a histogram, what would be the best description of
Question:
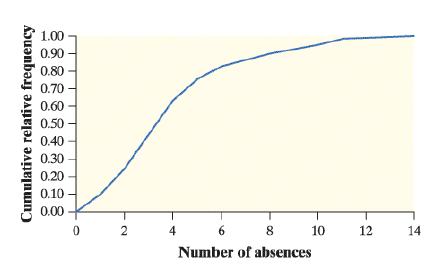
If the distribution of absences was displayed in a histogram, what would be the best description of the histogram’s shape?
a. Symmetric
b. Uniform
c. Skewed left
d. Skewed right
e. Cannot be determined
The number of absences during the fall semester was recorded for each student in a large elementary school. The distribution of absences is displayed in the following cumulative relative frequency graph.
Select the best answer.
Fantastic news! We've Found the answer you've been seeking!
Step by Step Answer:
The plot given represents the cumulative relative frequency plot of absences We have to ma...View the full answer

Answered By
Adeeb Hasan
I'm an Electronics Engineering graduate from one of the premier institutes in India, the Indian Institute of Space Science and Technology(IIST). I got admission into IIST by clearing one of the difficult entrance exams in India, IIT-JEE. I got a good base in both mathematics and physics during my preparation for JEE-mains and JEE-advanced. I have strengthened my knowledge in these subjects by attending various competitive tests during my school days. I loved to study and work on mathematics while I was in school which helped me in my graduate studies and tutoring career.
I am tutoring online for more than three years now. I have worked for tutoring sites like Chegg and course hero in the past years. In real life, I have good teaching experience. During my high school and higher secondary studies, it was compulsory that each student presents a seminar every week. It was frustrating to face an audience in the beginning, but now I can say I have evolved to become a better teacher. Some people may have deep knowledge but may find difficulty in conveying the concepts to his/her students. The vice versa can also happen. Only through continuous experience in teaching can we rectify this. My college has a special club called 'NIRMAN' which serves as a platform for educating the tribal students nearby college. I can proudly say that I am an active member in this venture, and have taken classes in many sessions. Currently, I am preparing for the CAT examination after the completion of my undergraduate course.
I am a person who believes in understanding the concepts behind every subject that we study; rather than just mugging it up. Only then can we make our foundations in that particular subject strong. It is both dangerous to have less knowledge than having a deep understanding as well as no knowledge at all. This is the motivation behind my studies. I have taught students from various schools and most of the sessions were related to Mathematics and its applications in our day-to-day life. Apart from these, I take maths classes for IIT-JEE aspirants in a coaching institute nearby.
0 Reviews
10+ Question Solved
Related Book For 

Question Posted:
