

Kerry and Danielle wanted to investigate whether tapping on a can of soda would reduce the amount
Question:
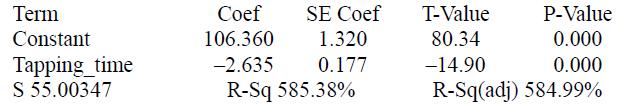
Kerry and Danielle wanted to investigate whether tapping on a can of soda would reduce the amount of soda expelled after the can has been shaken. For their experiment, they vigorously shook 40 cans of soda and randomly assigned each can to be tapped for 0 seconds, 4 seconds, 8 seconds, or 12 seconds. After waiting for the fizzing to stop, they measured the amount expelled (in milliliters) by subtracting the amount remaining from the original amount in the can. Here is some computer output from a regression of y = amount expelled on x = tapping time:
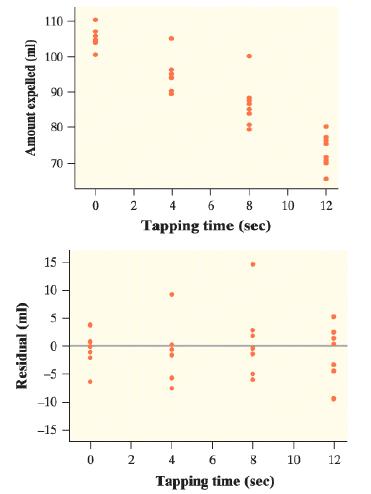
a. Is a line an appropriate model to use for these data? Explain how you know.
b. Find the correlation.
c. What is the equation of the least-squares regression line? Define any variables that you use.
d. Interpret the values of s and r2.
Step by Step Answer:
The answer is given as follows A linear model is appropriate The scatter plot ...View the full answer


