

Refer to Exercise 102. Find the interquartile range of the fat content distribution shown in the dotplot.
Question:
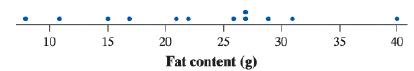
Refer to Exercise 102. Find the interquartile range of the fat content distribution shown in the dotplot.
Exercise 102.
Here is a dotplot of the amount of fat (to the nearest gram) in 12 different hamburgers served at a fast-food restaurant:
Fantastic news! We've Found the answer you've been seeking!
Step by Step Answer:
To find the interquartile range IQR of the fat content distribution shown in the dotplot we first ne...View the full answer

Answered By
Jeff Omollo
I have experience of solving Questions and problem of real life examples , also solving Questions related my degree I'm learn all computer . I'm interested in hardware of computers and all technical devices
0 Reviews
10+ Question Solved
Related Book For 

Question Posted:
