

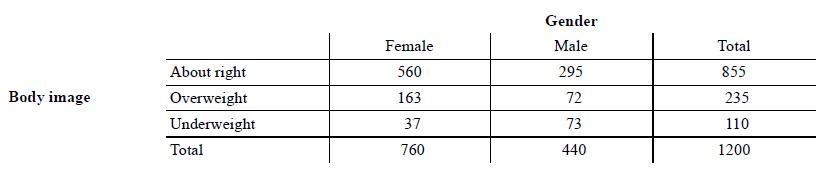
Refer to Exercise 25. a. Of the respondents who felt that their body weight was about right,
Question:
Refer to Exercise 25.
a. Of the respondents who felt that their body weight was about right, what proportion were female?
b. Of the female respondents, what percent felt that their body weight was about right?
c. The segmented bar graph displays the distribution of perceived body image by gender. Describe what this graph reveals about the association between these two variables for the 1200 college students in the sample.
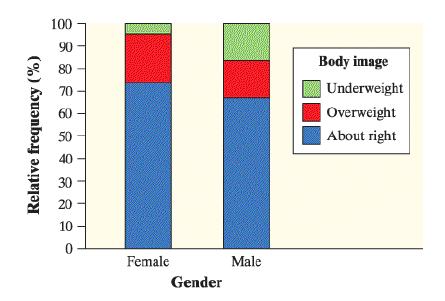
Exercise 25.
A random sample of 1200 U.S. college students was asked, “What is your perception of your own body? Do you feel that you are overweight, underweight, or about right?” The two-way table summarizes the data on perceived body image by gender.
Fantastic news! We've Found the answer you've been seeking!
Step by Step Answer:
a Of the respondents who felt that their body weight was about rig...View the full answer

Answered By
Nazish Bibi
I have MPhil in statistics from quaid-i-Azam university. I am expert in statistics, probability linear algebra and calculus. I can help you related to these topics. I am working as an online tutor for many years.
0 Reviews
10+ Question Solved
Related Book For 

Question Posted:
