

Refer to Exercise 48. Describe the distribution. Exercise 48. The dotplot shows the difference (Highway City)
Question:
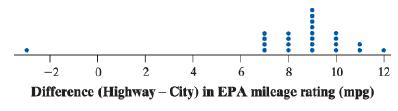
Refer to Exercise 48. Describe the distribution.
Exercise 48.
The dotplot shows the difference (Highway − City) in EPA mileage ratings, in miles per gallon (mpg) for each of 24 model year 2018 cars.
Fantastic news! We've Found the answer you've been seeking!
Step by Step Answer:
From the dotplot we can see that the distribution of th...View the full answer

Answered By
Churchil Mino
I have been a tutor for 2 years and have experience working with students of all ages and abilities. I am comfortable working with students one-on-one or in small groups, and am able to adapt my teaching style to meet the needs of each individual. I am patient and supportive, and my goal is to help my students succeed.
I have a strong background in math and science, and have tutored students in these subjects at all levels, from elementary school to college. I have also helped students prepare for standardized tests such as the SAT and ACT. In addition to academic tutoring, I have also worked as a swim coach and a camp counselor, and have experience working with children with special needs.
0 Reviews
10+ Question Solved
Related Book For 

Question Posted:
