

Refer to Exercise 75. a. Use your calculator to make a Normal probability plot of the data.
Question:
Refer to Exercise 75.
a. Use your calculator to make a Normal probability plot of the data. Sketch this graph on your paper.
b. What does the graph in part (a) imply about whether the distribution of refrigerator capacity is approximately Normal? Explain.
Exercise 75.
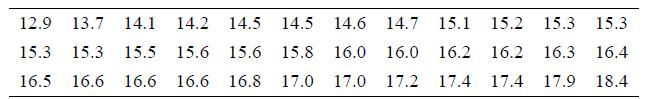
Consumer Reports magazine collected data on the usable capacity (in cubic feet) of a sample of 36 side-byside refrigerators. Here are the data:
Fantastic news! We've Found the answer you've been seeking!
Step by Step Answer:
a explication in Part a explication in Part a You may create the normal ...View the full answer

Answered By
Aketch Cindy Sunday
I am a certified tutor with over two years of experience tutoring . I have a passion for helping students learn and grow, and I firmly believe that every student has the potential to be successful. I have a wide range of experience working with students of all ages and abilities, and I am confident that I can help students succeed in school.
I have experience working with students who have a wide range of abilities. I have also worked with gifted and talented students, and I am familiar with a variety of enrichment and acceleration strategies.
I am a patient and supportive tutor who is dedicated to helping my students reach their full potential. Thank you for your time and consideration.
0 Reviews
10+ Question Solved
Related Book For 

Question Posted:
