

Refer to Exercise 92. Here are a boxplot and some numerical summaries of the birthrate data: a.
Question:
Refer to Exercise 92. Here are a boxplot and some numerical summaries of the birthrate data:
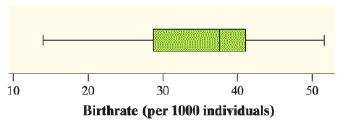
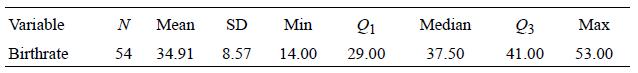
a. Explain why the median and IQR would be a better choice for summarizing the center and variability of the distribution of birthrates in African countries than the mean and standard deviation.
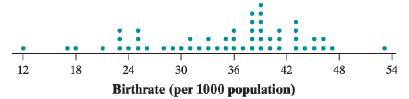
b. Identify an aspect of the distribution that the dotplot in Exercise 92 reveals that the boxplot does not.
Exercise 92.
One of the important factors in determining population growth rates is the birthrate per 1000 individuals in a population. The dotplot shows the birthrates per 1000 individuals (rounded to the nearest whole number) for 54 African nations.
Fantastic news! We've Found the answer you've been seeking!
Step by Step Answer:
When there are no outliers in a sample the mean and standard deviation are used to summarize a typic...View the full answer

Answered By
Sandra Dimaala
Sandra from Philippines ,LICENSED PROFESSIONAL TEACHER.
Teachers are our nation builders—the strength of every profession in our country grows out of the knowledge and skills that teachers help to instill in our children. And, as a nation, we must do much, much more to fully appreciate and support their work.
0 Reviews
10+ Question Solved
Related Book For 

Question Posted:
