

Researchers collected data on 76 brands of cereal at a local supermarket. For each brand, the sugar
Question:
Researchers collected data on 76 brands of cereal at a local supermarket. For each brand, the sugar content (grams per serving) and the shelf in the store on which the cereal was located (1 = bottom, 2 = middle, 3 = top) were recorded. A dotplot of the data is shown here.
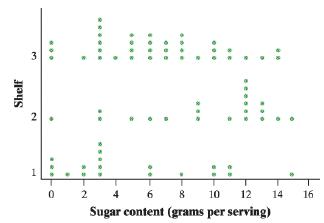
a. Is the variability in sugar content of the cereals on the three shelves similar or different? Justify your answer.
b. Critics claim that supermarkets tend to put sugary cereals where kids can see them. Do the data from this study support this claim? Justify your answer. Note that Shelf 2 is at about eye level for kids in most supermarkets.
Fantastic news! We've Found the answer you've been seeking!
Step by Step Answer:
1 As per market research arrangements of cereals are based upon demands among age group visibili...View the full answer

Answered By
Naresh Mondal
Hi. I have done BE chemical in 2008. After that I am working as a tutor for mathematics and statistics. Also I am working as a full time sales manager in GI agrotech Pvt ltd. Through my teaching I have changed downward progress graph of students to upward progress graph.
0 Reviews
10+ Question Solved
Related Book For 

Question Posted:
